Is your training going up or down? How to read workout trends
Daily numbers jump around. Learn to read a workout progress tracker: 7-day averages, four-week windows, plateaus and the signs that you should ease off.
revns editorial · Published November 13, 2026 · 9 min read
How to tell if training is improving: use 7-day averages, compare four-week blocks, separate noise from signal, and know the plateau and overload signs. Sources: Obes Facts, ACSM, BJSM.
To tell whether your training is going up or down, compare weeks, not days. Take a 7-day average of the numbers you care about, compare the last two to four weeks with the four weeks before, and change only one thing at a time. A single bad session or a heavy scale reading is noise. A line that moves the same way for three or four weeks is a signal.
This guide shows how to read a workout progress tracker without fooling yourself. It covers which numbers to track, how long to wait, what a plateau looks like, and when a falling line means rest, not effort.
TL;DR
| Question | Rule of thumb |
|---|---|
| How long is one fair window? | Two to four weeks, compared with the block before |
| How do I smooth a noisy number? | Use a 7-day average (weight, steps, sleep, resting heart rate) |
| What counts as progress? | More load or reps at the same effort, faster at the same heart rate, or more days on target |
| How do I read a plateau? | No change for three to four weeks with steady sleep and effort |
| What is a warning sign? | Falling performance, poor sleep and low mood together for more than a week or two |
| What do I change first? | One variable: load, volume, sleep or food, not all at once |
Why is one day of data so misleading?
A day is a small sample, and many things you do not control land on it. A poor night, a late meal, heat, a stressful meeting and a new exercise can all change how a session feels.
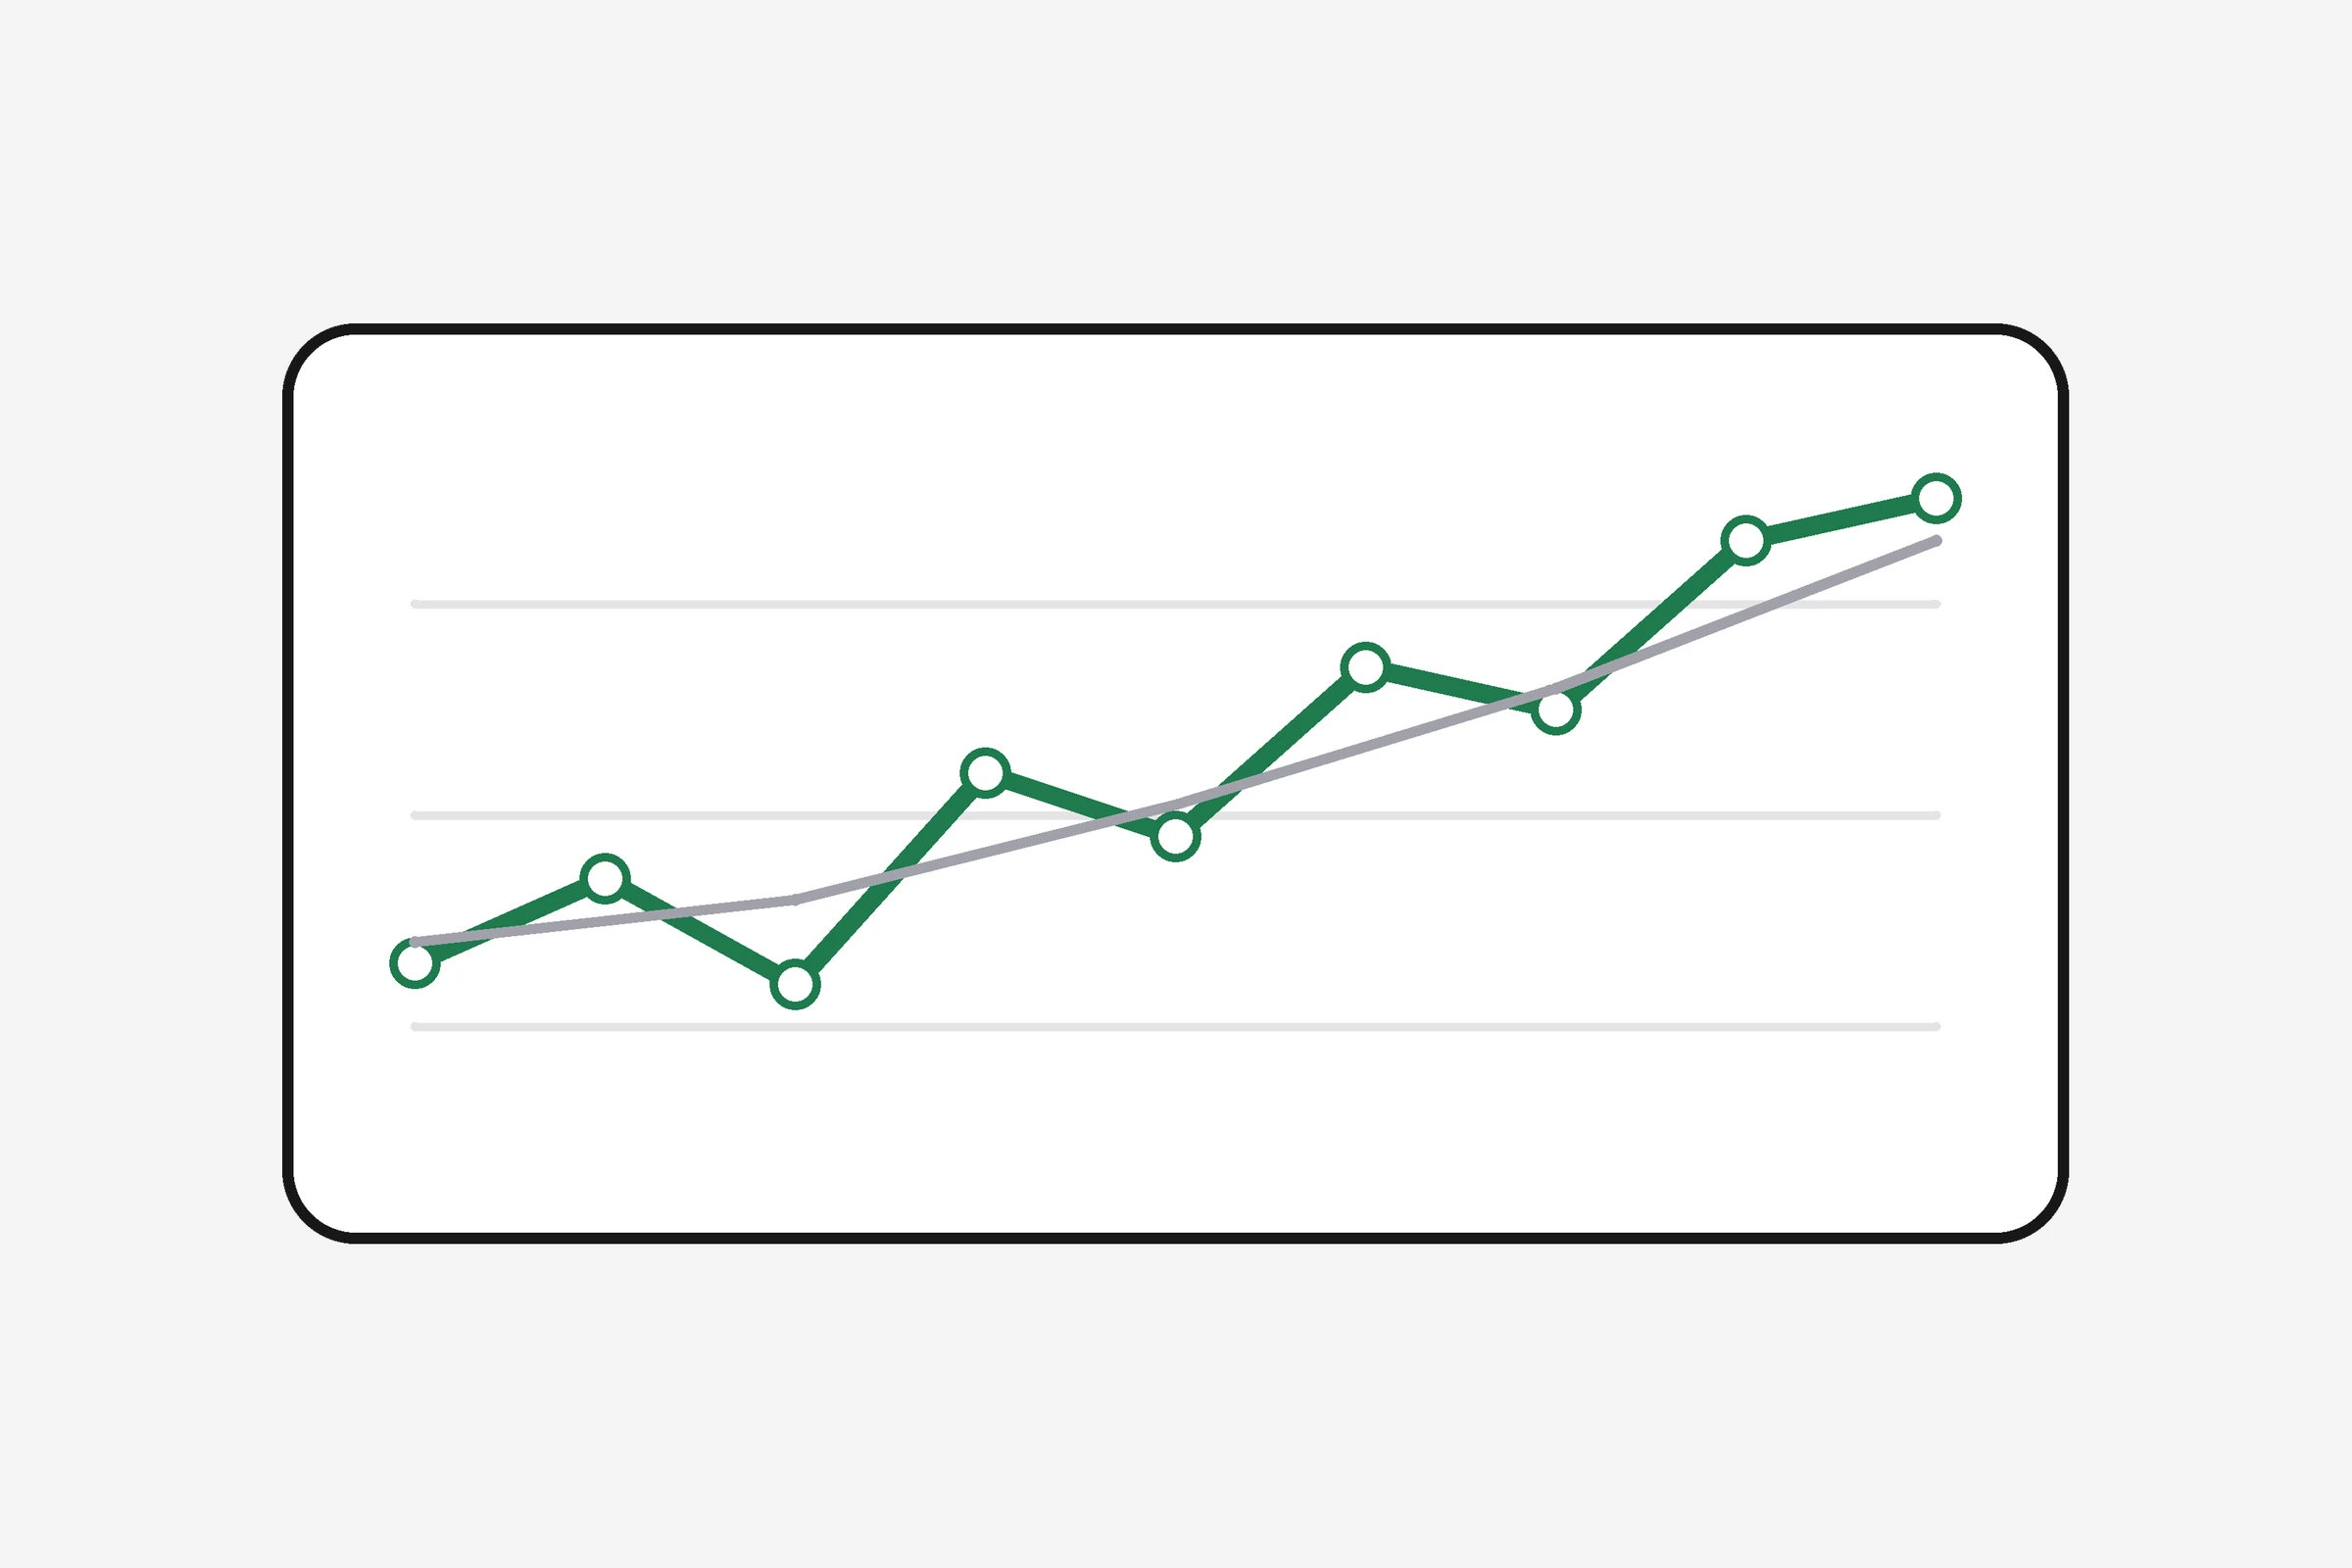
Body weight shows this well. A 2014 study in Obesity Facts by Orsama and colleagues analysed 4,657 daily weight readings from 80 adults (aged 25 to 62, BMI 20.0 to 33.5). They found a group-level weekly rhythm: weight tended to rise over the weekend and fall through the week. The authors concluded that weekend to weekday swings should be seen as normal, not as signs of weight gain, and that long-term habits matter more than short-term splurges. The study was retrospective and covered one group, so it shows a pattern, not what will happen to you.
The same idea applies to other numbers. Steps, sleep hours, resting heart rate and how heavy a lift feels all swing from day to day. If you react to each swing, you will change your plan too often and learn very little from any change.
What is a 7-day average, and when should I use it?
A 7-day average is the mean of the last seven days, recalculated each day. One unusual day carries one seventh of the weight, so the line moves slowly and shows direction.
Use it for numbers you measure:
- Body weight (if weight is a goal for you)
- Daily steps
- Hours of sleep
- Resting heart rate, if you wear a tracker
- Mood or energy scores on a fixed 1 to 5 scale
Do not use it for numbers you do or do not do, such as "I trained today". For those, count days on target over a week instead. A blank is not a zero: if you did not log a day, leave it out of the average instead of counting it as nothing.
The weekly health check-in guide shows a small set of five numbers to average once a week. The trends and weekly review page in revns shows body measures with a 7-day average and a previous-period comparison, so you do not have to work it out by hand.
Which numbers show that training is going up?
Pick the numbers that match your goal. Strength, endurance and habit goals each have a clear signal.
| Goal | Signal that it is going up | Where to look |
|---|---|---|
| Strength | More weight or more reps at the same effort | Top set per lift, compared across four weeks |
| Running or cycling | Same pace at a lower heart rate, or a longer easy session | Easy-effort sessions only |
| General fitness | More days on target, fewer missed weeks | Days per week with a session |
| Body weight or measurements | The 7-day average moves in your chosen direction | Two to four week trend |
| Recovery | Higher energy and sleep, steadier resting heart rate | Weekly averages |
For strength, the American College of Sports Medicine position stand on progression models in resistance training says that when a person can do the current load for one to two repetitions over the planned number, a load increase of about two to ten percent is a reasonable step. This is a guide for healthy adults, and you should adjust it to your own technique and joints. The progressive overload guide explains this in plain words, and the one-rep max calculator turns a hard set into an estimate you can compare across weeks.
For endurance, compare like with like. A run at the same easy effort on the same route is a fair test. A race, a hot day and a hilly route are not. The zone 2 training guide shows how to keep easy days easy so that a lower heart rate at the same pace has meaning.
For habits, the signal is simpler. The 2020 WHO guidelines, published in the British Journal of Sports Medicine, advise adults to do 150 to 300 minutes of moderate activity a week, or 75 to 150 minutes of vigorous activity, plus muscle-strengthening on two or more days. Count how many weeks you meet that target. If you trained on three days a week for four weeks and on four days a week for the next four, the trend is up, even if no single session was special.
How do I compare weeks fairly?
Use windows that are long enough to smooth noise and short enough to react. Four weeks is a good default.
- Pick a window. Last four weeks against the four weeks before.
- Compare the averages, not the best day and not the worst day.
- Check that effort was similar. A faster run is less impressive if you tried twice as hard.
- Check the context. Illness, travel, a new job or a heat wave can explain a dip.
- Write one sentence. "Squat top set up 5 kg, steps flat, sleep down 20 minutes." One sentence forces a clear read.
Revns lets you pick 14, 28, 56 or 90 days on the main chart, and a twelve-week map shows how consistent you were, with darker days for higher scores. A short window shows recent change. A long one shows the season. Look at both before you decide.
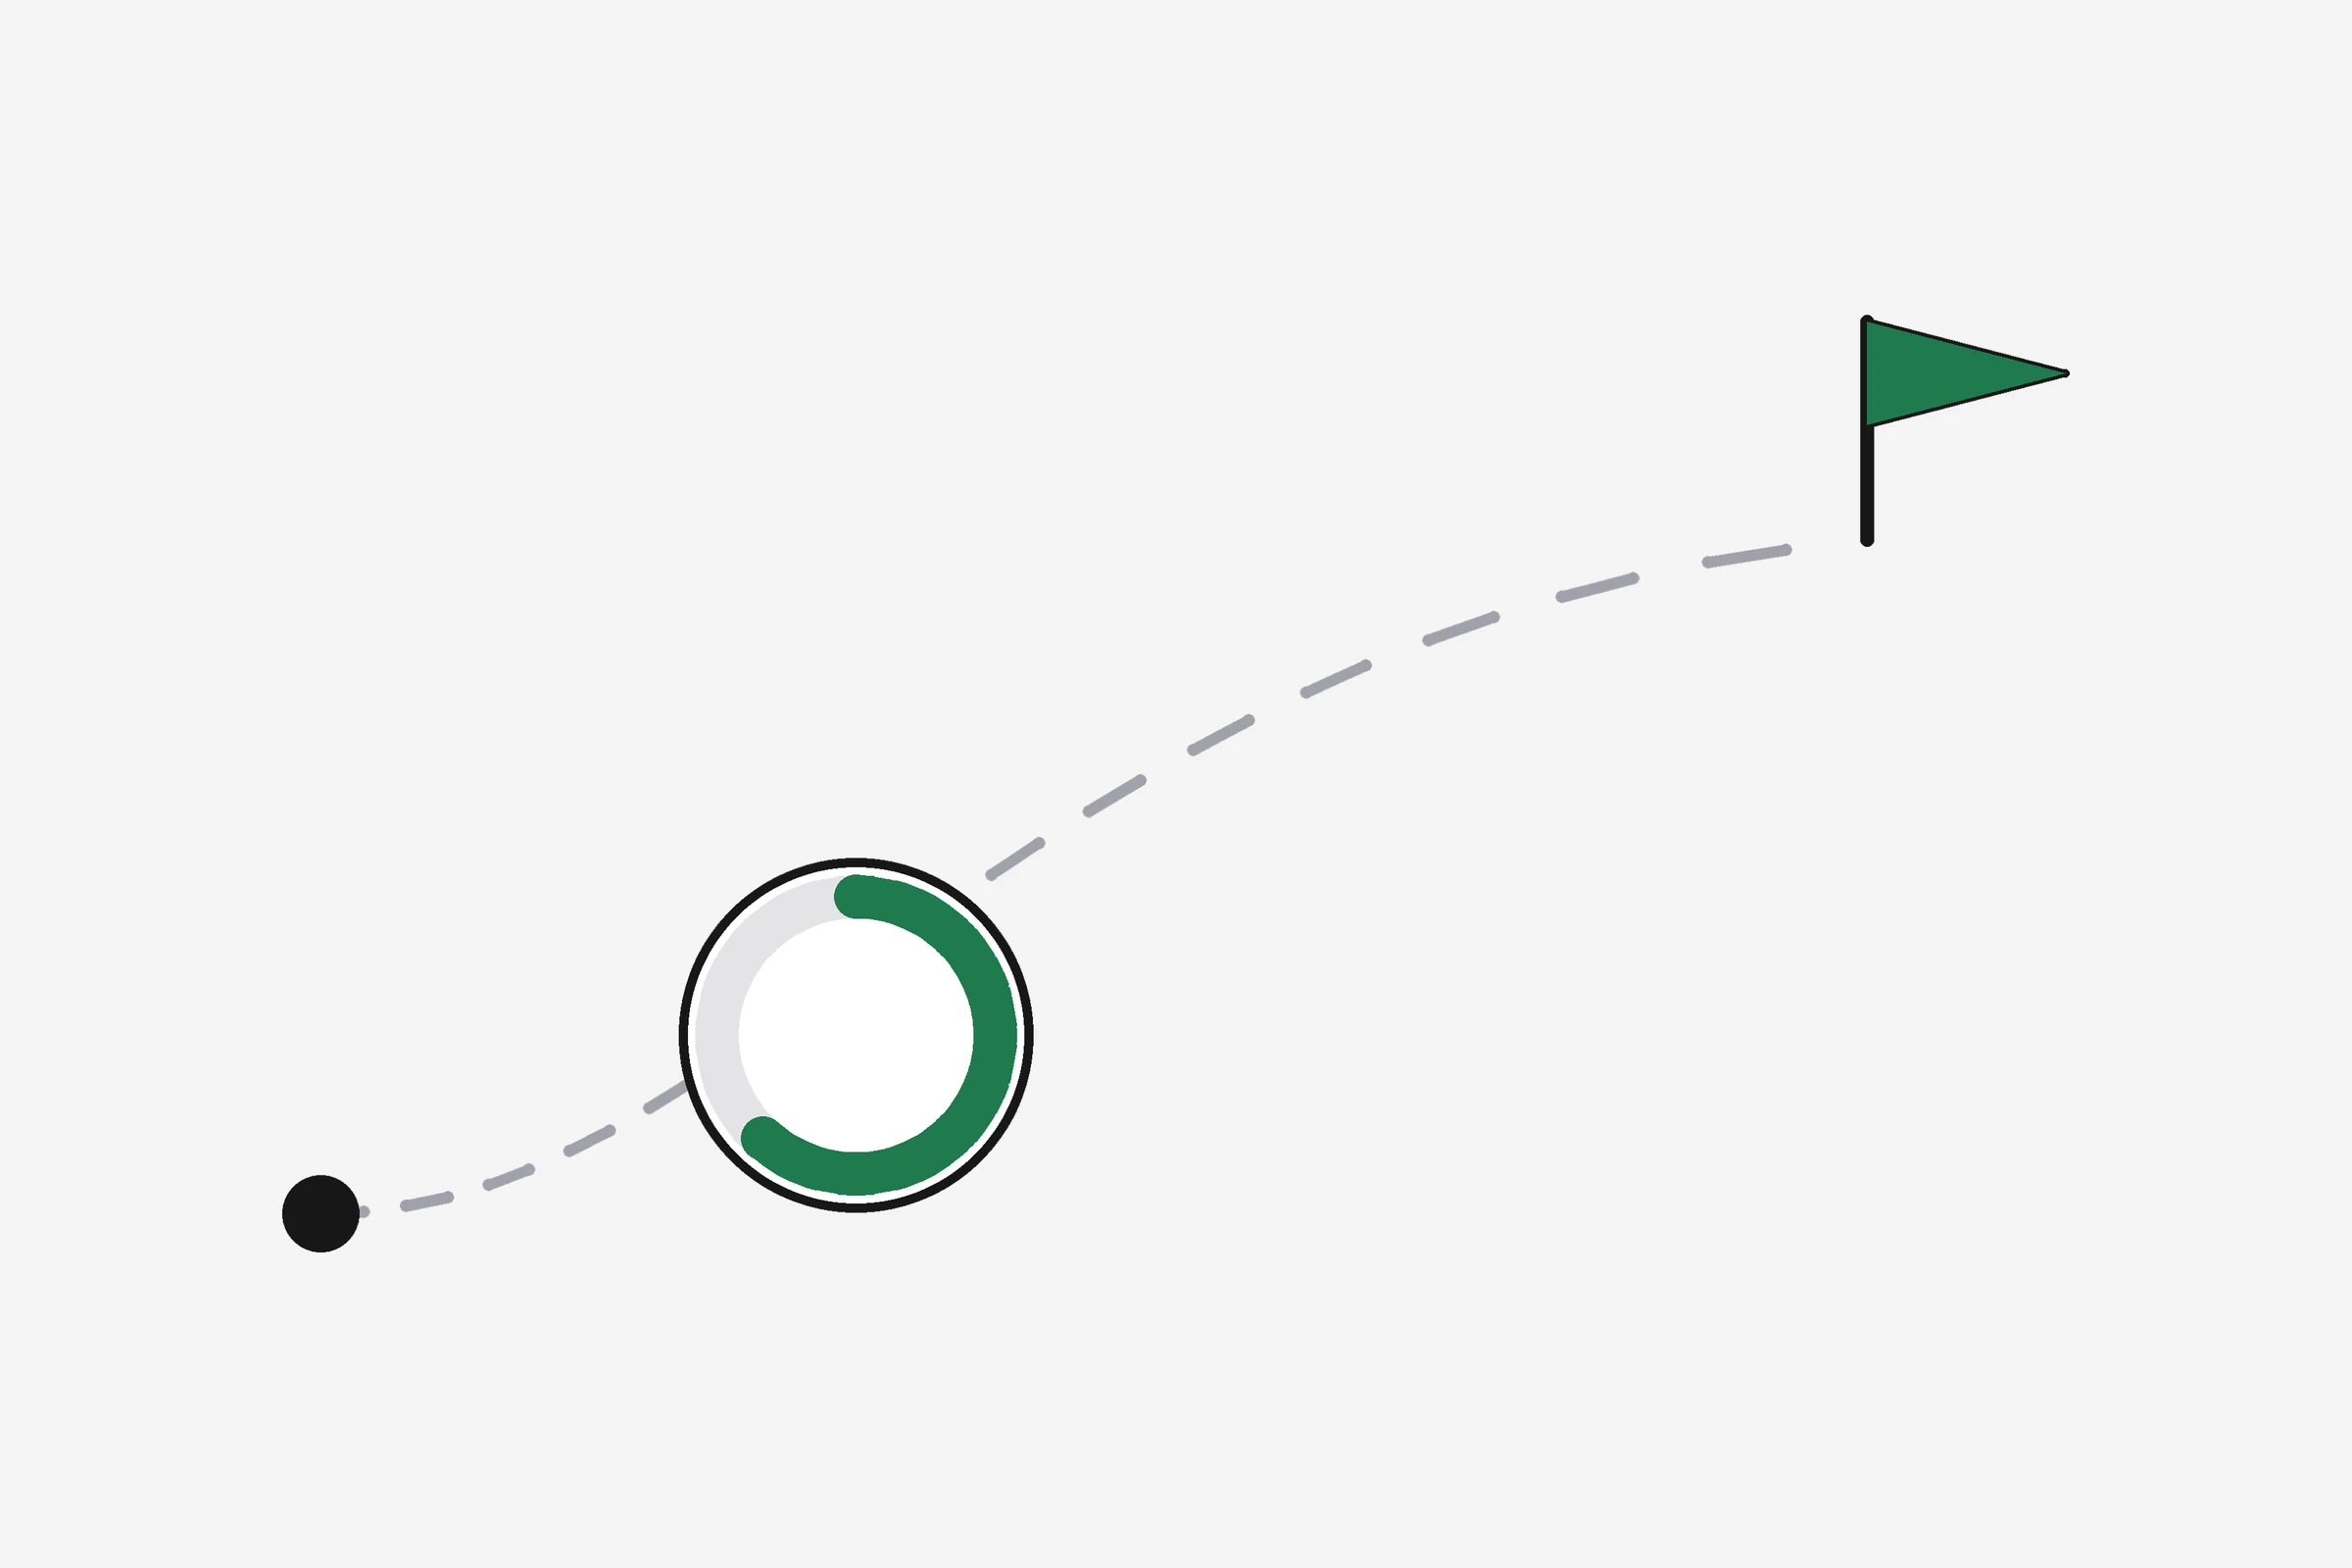
If you have a target, a pace helps more than a single number. A goal with a date shows the change you need per week and the change you are making now. Pair a goal with a smoothed current level so one bad day does not make you look off track.
What does a plateau look like, and what should I do about it?
A plateau is a stretch where the number you care about does not move, even though you keep training. It is common and often a sign that the body has adapted to the current load.
Rule of thumb: three to four weeks with no change in a number you care about, while sleep and effort were steady. Do not call a plateau after one flat week.
Before you add more training, check these in order:
- Sleep. Is your 7-day average below your own floor? The sleep guide covers targets by age.
- Food. Are you eating enough protein and enough energy for the work? The protein guide gives ranges for vegetarian, vegan, eggetarian and non-vegetarian diets.
- Stress. A hard period at work or at home lowers what you can recover from.
- Load. Did you repeat the same session for months? Small, steady increases in load, reps or sets are the usual fix.
- Recovery. Did you take an easier week in the last six to eight weeks? A planned lighter week often ends a plateau. See the rest days guide.
Then change one thing for the next two to four weeks. If you change load, sleep, food and plan together, you will not know what worked.
When does a falling line mean "rest", not "try harder"?
Sometimes the line goes down because you are tired. A 2016 systematic review in the British Journal of Sports Medicine by Saw and colleagues looked at 56 studies of how athletes respond to training. It reported that self-reported measures, such as mood, fatigue and sleep quality, tracked changes in training load more consistently than many common objective measures. That supports logging how you feel next to your numbers.
Read the lines together. If these appear at once, take an easier week:
- Performance drops for more than a week or two
- Sleep is below your floor
- Mood or energy scores fall for most days
- Resting heart rate is up several beats on its 7-day average
- Sessions feel hard at weights or paces that were easy
The stress, burnout and deload guide covers what a lighter week looks like. The mood and energy guide shows how to log those scores in ten seconds.
Trend lines do not diagnose anything. They show a pattern that you can act on or take to a professional.
How do I stop reading noise as news?
A few habits keep your reading honest.
- Weigh at the same time under the same conditions, or skip the scale if it upsets you. Use the average.
- Log blanks as blanks. A missed day is unknown, not zero, and not a failure.
- Do not edit a plan after one session. Wait for the next block.
- Do not compare with others' numbers. Compare with your own last block.
- Keep one chart as the main one. Too many charts invite too many reactions.
- Ask what else changed. New shoes, a new programme, an illness or time zone changes all show up in the data.
A trend also depends on how complete your data is. If you logged on only three of the last fourteen days, the average is not worth much. Log lightly and often, and judge on a fixed day each week.
What should I do this week?
If you are new to tracking
- Pick two numbers: one for effort (a top set or an easy-run pace) and one for consistency (training days).
- Log them for four weeks. Do not change your plan yet.
- At the end, write one sentence: up, flat or down, and what else changed.
If you already track many things
- Cut your main chart down to one metric tied to your goal.
- Switch from daily values to 7-day averages for weight, steps and sleep.
- Set a review day. Compare the last four weeks with the four before.
- Change one variable only. Write down what and when.
If you use an AI assistant
You can connect an assistant to your own log through the Model Context Protocol. Ask it to compare the last four weeks with the four before and to name the habit you missed most. It reads the numbers, and you choose what to change. Keep in mind it does not know about illness, travel or stress unless you log them.
When should I see a professional?
A trend chart is not a medical test. See a doctor or another qualified clinician if you notice:
- Chest pain, fainting, or breathlessness at an easy effort
- A resting heart rate that jumps and stays up, with symptoms
- Weight loss you did not plan
- Low mood on most days for more than two weeks, or any thought of harming yourself (contact your local crisis line or emergency services at once)
- Pain that does not ease with rest, or swelling after an injury
If a trend is falling and you do not know why, a clinician can check things a log cannot, such as iron, thyroid and sleep problems. A coach can review your plan.
Related
- Five numbers worth a weekly health check-in
- Progressive overload in plain words
- Stress, burnout and when to deload
- Trends and weekly review in revns
- Goal tracking in revns
This is general training guidance, not medical advice. If you have a health condition, an injury or symptoms, talk to a qualified clinician before you change your training.
Sources
- Orsama AL, Mattila E, Ermes M, van Gils M, Wansink B, Korhonen I. Weight rhythms: weight increases during weekends and decreases during weekdays. Obes Facts 2014
- American College of Sports Medicine. Progression models in resistance training for healthy adults. Med Sci Sports Exerc 2009
- Saw AE, Main LC, Gastin PB. Monitoring the athlete training response: subjective self-reported measures trump commonly used objective measures: a systematic review. Br J Sports Med 2016
- Bull FC et al. World Health Organization 2020 guidelines on physical activity and sedentary behaviour. Br J Sports Med 2020
Terms in this post
revns publishes training and nutrition guidance, not medical advice. See a clinician for symptoms, injury or a medical condition. Accurate as of November 13, 2026.