Fitness trends and a weekly review that explain themselves
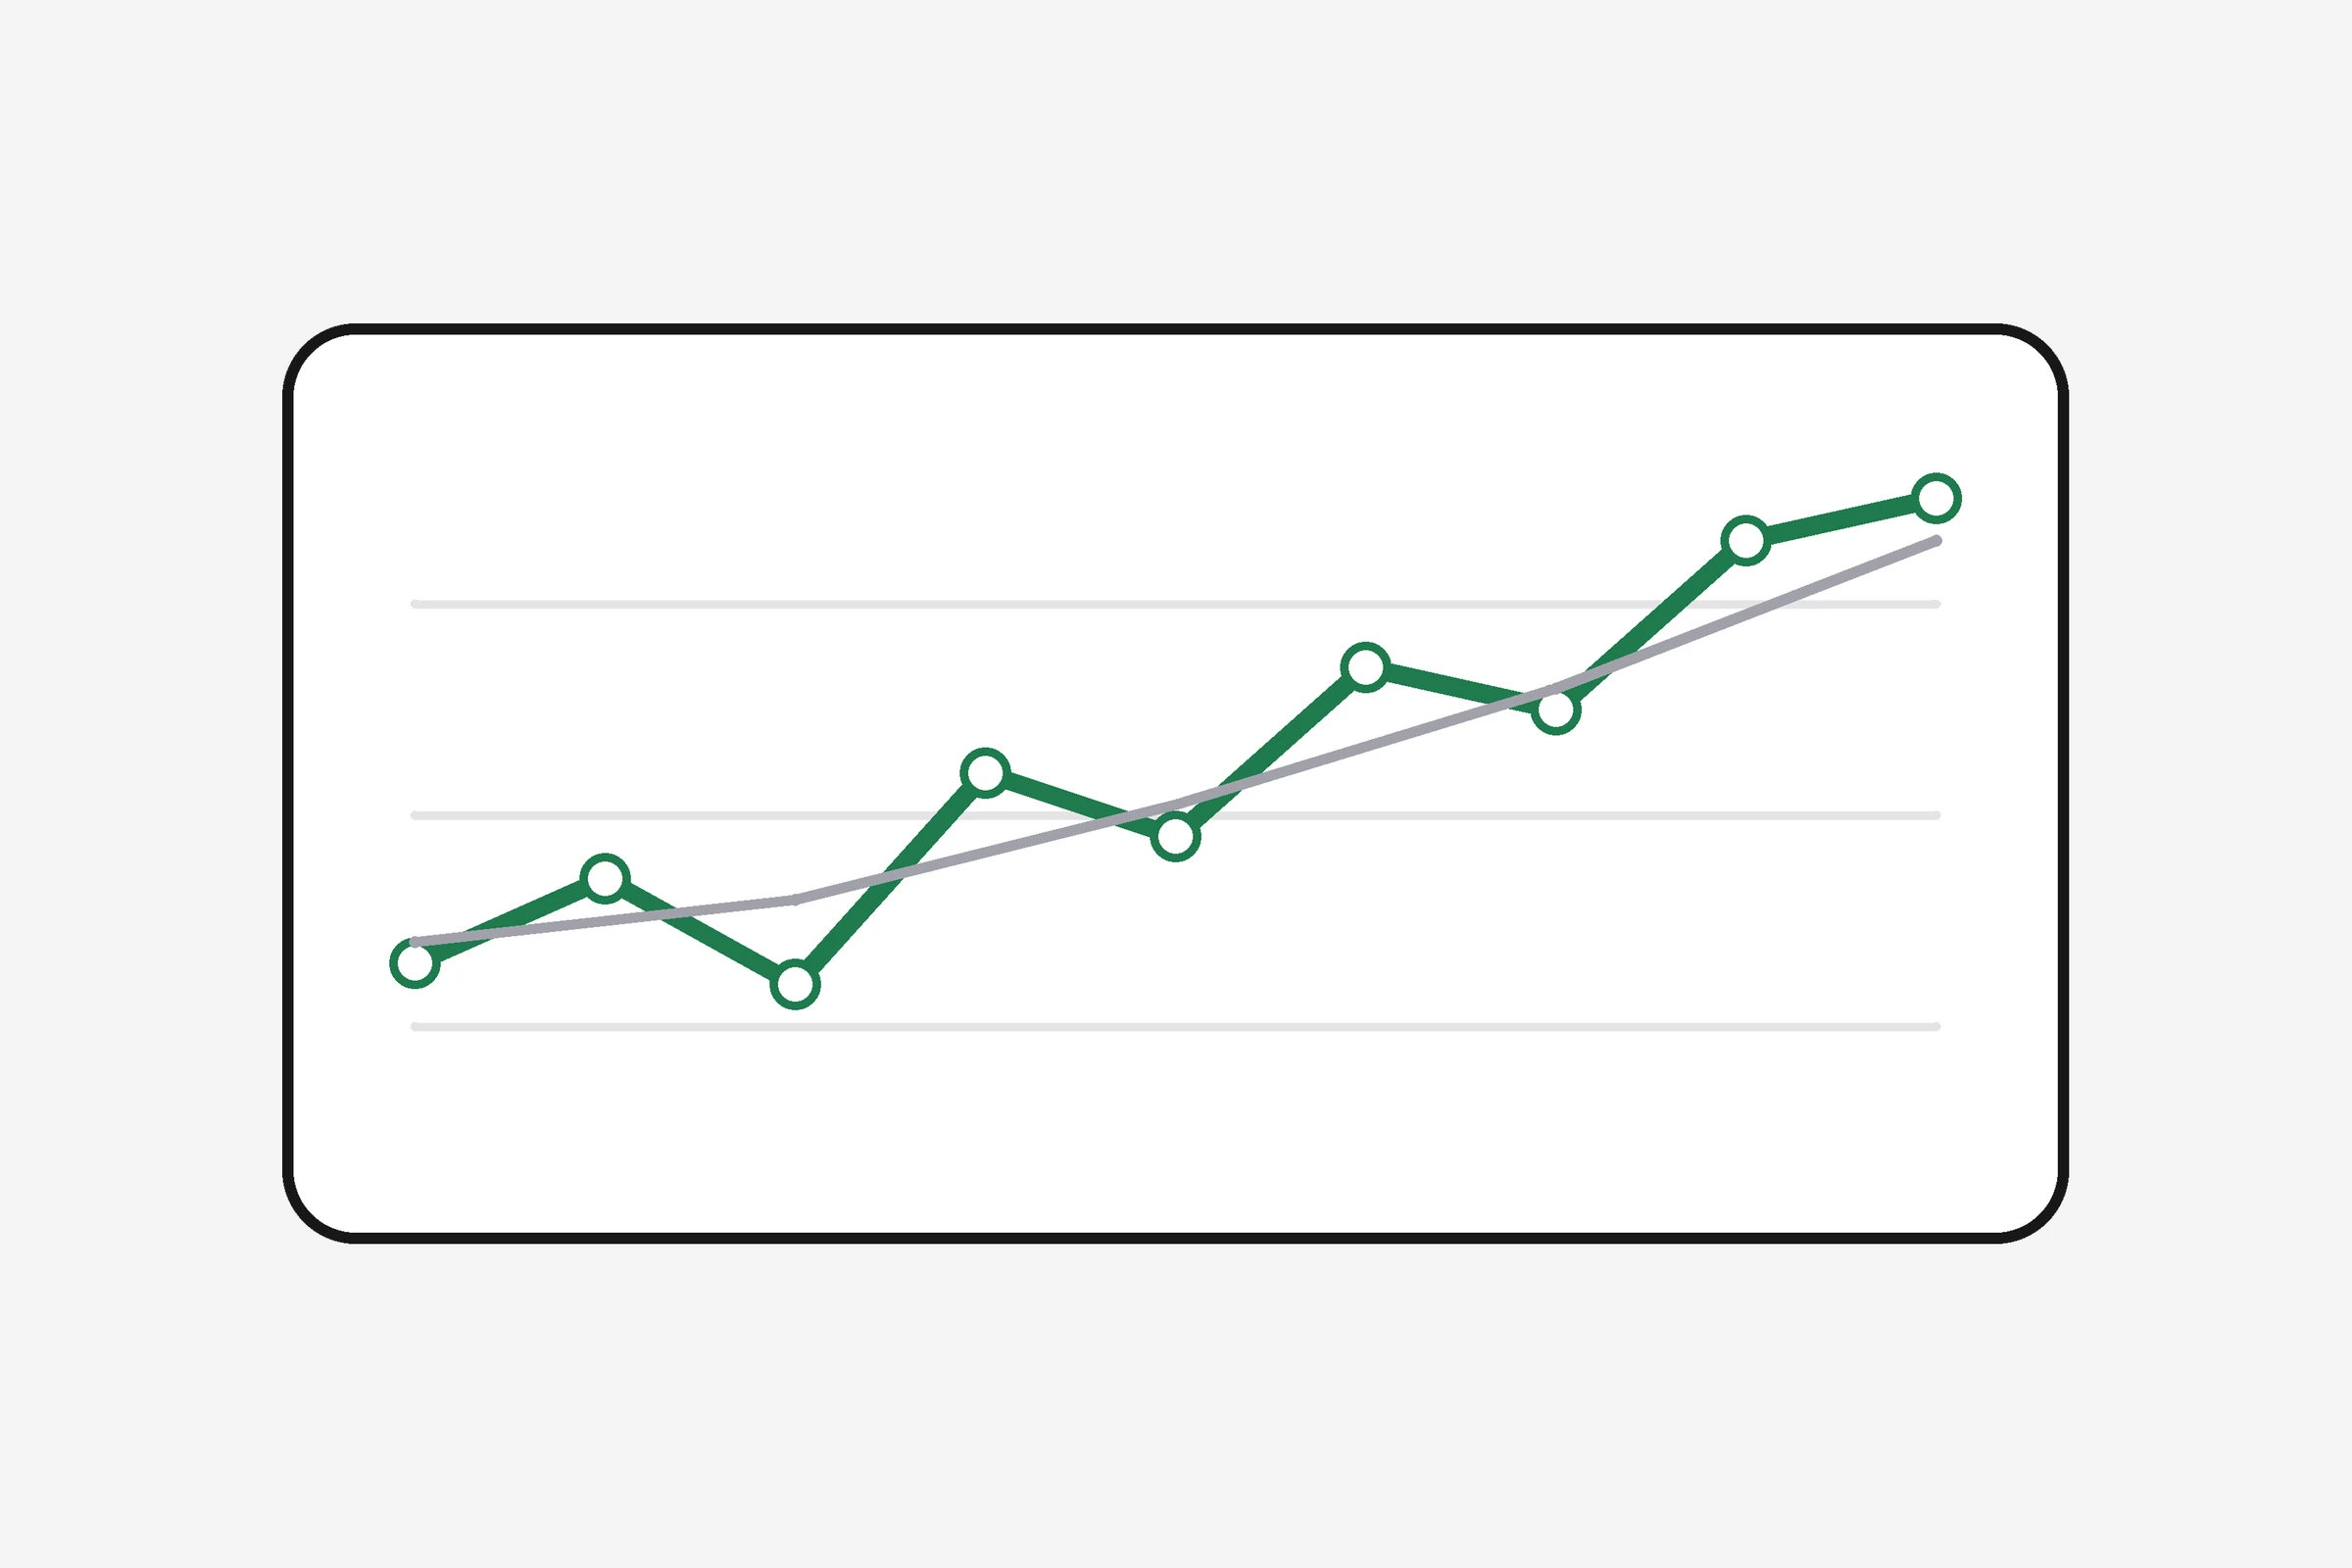
Trends answers one question: is it working? See your day score over 14 to 90 days, any metric with its previous-period comparison and a 7-day average for body measures, a twelve-week consistency map, and a weekly review that names your most consistent habits and the ones you missed.
How it works
- 1
Pick a range
14, 28, 56 or 90 days.
- 2
Read the main chart
Day score over time with hover values and a table view.
- 3
Drill into a metric
Any metric with its average and the change against the previous period; body measures get a 7-day average.
- 4
Review the week
Pillars this week against last, the best day, and the habits you hit or missed.
- Average
- 73
- vs previous
- +9
- Most consistent
- Steps 6/7
One chart at a time
Pick a metric and it becomes the main chart, with hover values and a table view.
Consistency at a glance
Twelve weeks of days, darker when the day score was higher.
Week in review
Pillar scores this week against last, the best day, and the habits on target five or more days.
Who uses it
"I could see steps slipping for three weeks before my weight stalled."
"The weekly review names the habit I keep missing."
"I export the data or let my AI read the trends and summarise them."
Illustrative examples of how people use the feature.
Questions
Can my AI read my trends?
Yes, through the get_trends and get_weekly_review tools on the MCP server.
Can I export the data?
Yes. Download everything as JSON from Settings at any time.
Is there a table view?
Yes, every chart has one for exact values and screen readers.
How far back does it go?
Everything you log or import is kept; the charts show up to 90 days at a time.
Guides
Free calculators
Your first brief is one entry away
Pick an objective, tell it how you eat, log one thing.